Infographics
Page 5
2D & 3D Cartesian Coordinates
The diagram below includes the 2D Cartesian coordinate graph, as many of us learn in school, and a cube, with labeled axes, for 3D Cartesian coordinates. The axis labeled, Z, represents the third dimension. Numbers in parenthesis, on the 2D graph, indicate normalized WebGL coordinates.
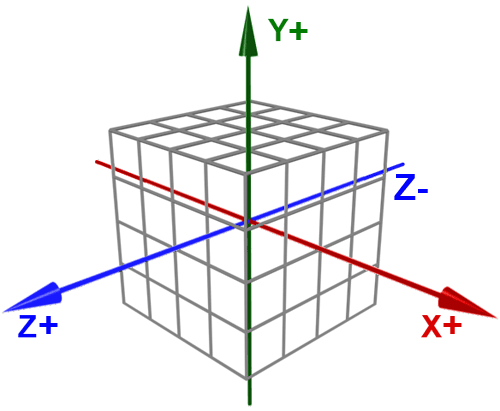 3D Cartesian Coordinates
Graphic for WebGL
3D Cartesian Coordinates
Graphic for WebGL
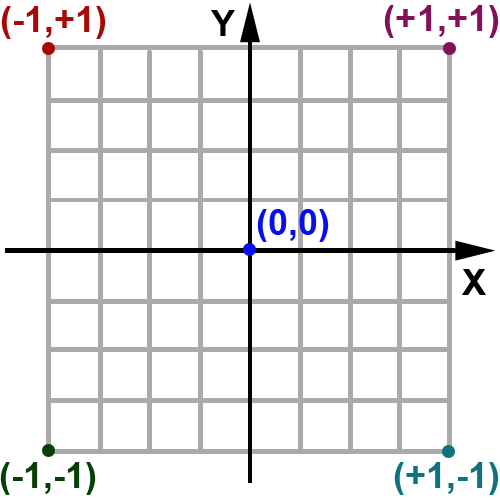 2D Cartesian Coordinate
Graph
2D Cartesian Coordinate
Graph
Infographics - Diagrams, Graphs, Charts
Infographics use charts, graphs, callouts, colors and images to convey concepts visually. Infographics are a form of technical illustration; often using cutaways, arrows with labels, exploded views, detail views, three dimensional or two dimensional images and blueprints to help viewers understand new ideas.