Infographics
Page 4
WebGL Stencils & Blending
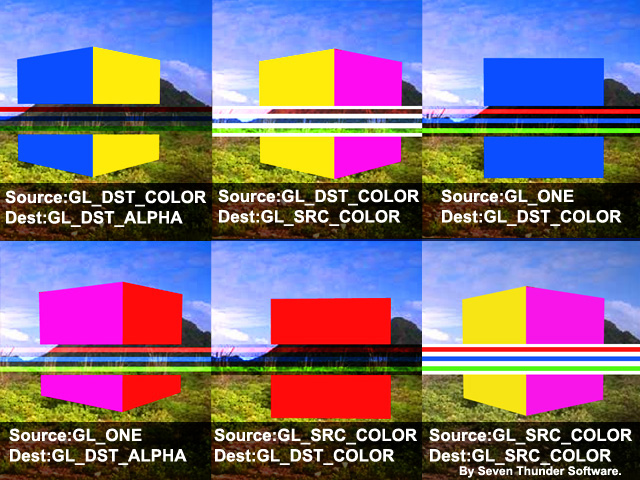
Two WebGL stencil with blending graphics, illustrate combining blend and stencil options. Three horizontal bars apply as stencils, which mask a cube with solid color faces. Stenciling reveals the background desert photograph with different visual effects, based on selected blend functions. Read more information below.
 Stencil & Blend
WebGL
Stencil & Blend
WebGL
 Textures Applied
to Stencil & Blend
Textures Applied
to Stencil & Blend
Infographics - Diagrams, Graphs, Charts
Infographics use charts, graphs, callouts, colors and images to convey concepts visually. Infographics are a form of technical illustration; often using cutaways, arrows with labels, exploded views, detail views, three dimensional or two dimensional images and blueprints to help viewers understand new ideas.
Tags
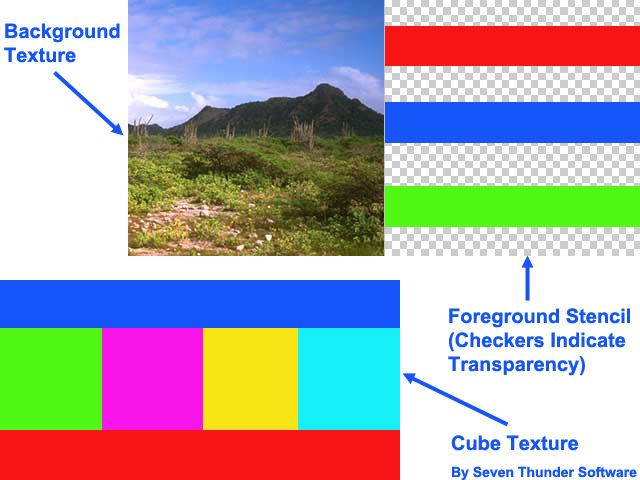
Textures Applied
The Textures Applied
graphic illustrates a background desert scene,
solid colors applied to a cube and a red, green, blue set of bars with transparent background.
Stencil & Blend
The Stencil & Blend
infographic illustrates one cube, covered with
the solid colored graphic. The background's the desert scene.
The bars that run across each section are the red, green, blue set of bars with transparent background.
When the Destination
or Source
blending options are changed, then
the stencil colors the cube and desert background with different values and hues.
The blending options are labeled under each cube as Source:
and Dest:
.
The WebGL blendFunc() method mixes the incoming, source
, colors
with values already in the frame buffer, called the destination
.