Infographics
Page 14
HSLA
See HSLA color and value ranges with vertical gradations in order from
full saturation to fifty percent alpha, twenty five percent saturation and twenty five percent brightness.
For details, use the search box above to find HSLA Color Features
.
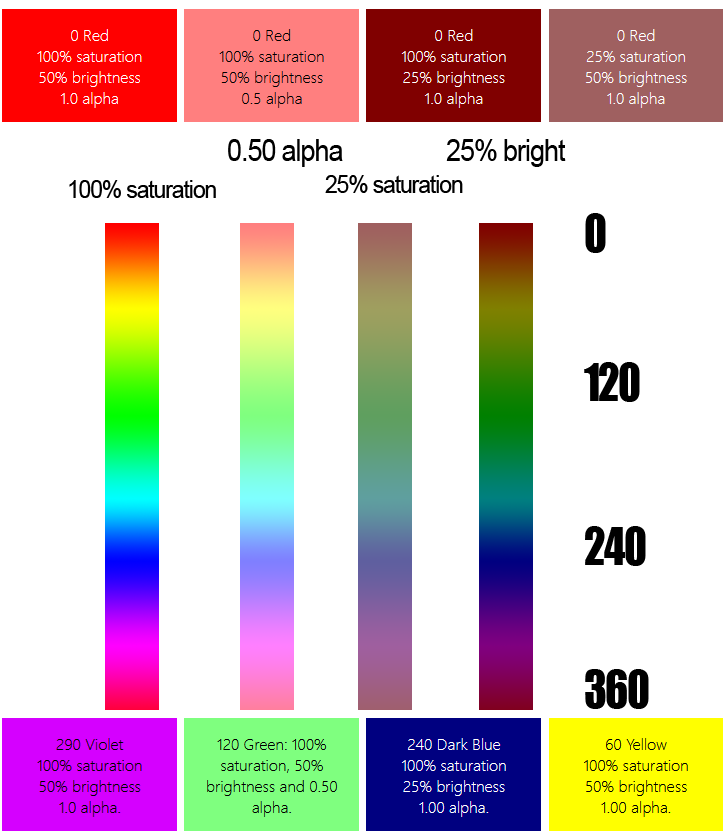 HSLA
Color & Value Range
HSLA
Color & Value Range
Markup for Linear Gradation
HTML5 markup for a fully saturated horizontal linear gradient, similar to the vertical far left gradient in the graphic on this page, displays below.
<div
style="
width:100%;
height:64px;
background-image: linear-gradient(
to right,
red, yellow,
green,
dodgerblue,
blue,
red);"
);
</div>
Infographics - Diagrams, Graphs, Charts
Infographics use charts, graphs, callouts, colors and images to convey concepts visually. Infographics are a form of technical illustration; often using cutaways, arrows with labels, exploded views, detail views, three dimensional or two dimensional images and blueprints to help viewers understand new ideas.